
How hot is your suburb
Published: 21 Oct 2022 9:38am
Council is seeking community feedback on its draft Urban Cooling Strategy, a 30-year plan aiming to help cool our city through sustainable future developments and adapting public spaces.
The draft strategy contains a wide range of actions that Council and the community can take to help reduce the impact of increasing temperatures and heat waves.
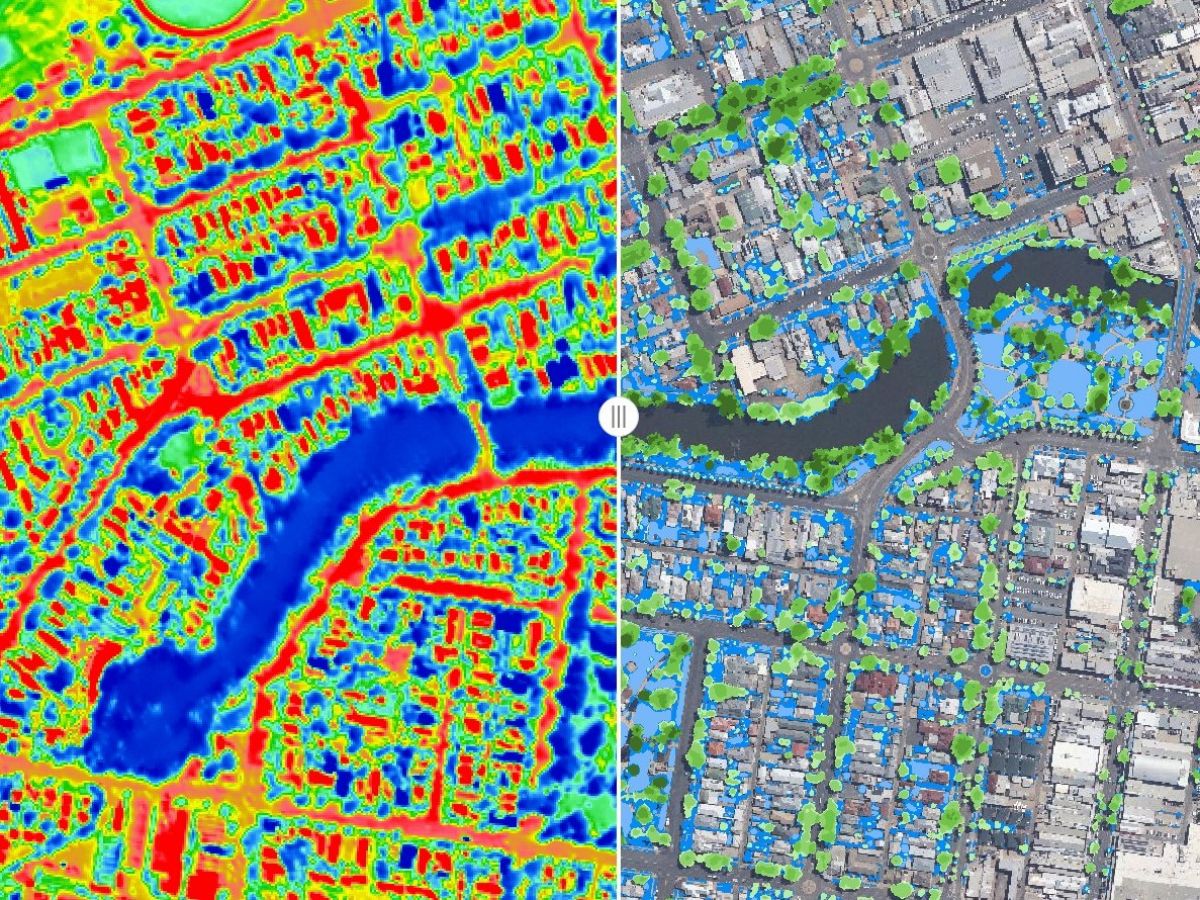
Manager Environment & Regulatory Services Mark Gardiner said Council undertook thermal imaging of the core urban areas around the city to gain an understanding of how suburbs compare in terms of temperature and canopy cover.
“The thermal imaging identified that where we have a lot of infrastructure, you have the urban heat island effect, where it’s absorbing heat and creating warmer temperatures than those you get in treed environments,” Mr Gardiner said.
“Also, in newer suburbs that don’t have a lot of tree canopy, there is an increase in the urban heat island effect.
“Among many other actions within the Urban Cooling Strategy, Council will look at developing a detailed tree management strategy which will drive how we approach tree planting through the city. We’ll strategically identify areas that need additional planting.”
Of the suburbs included in the imaging, Turvey Park emerged as the suburb with the highest canopy cover, at 16 per cent. Bomen had the lowest recorded canopy cover, with just two per cent.
In terms of temperature, Kapooka had the coolest median land surface of 27.3°C; Forest Hill the hottest at 31°C.
The strategy includes actions that community members can undertake, such as planting more trees and shrubs in your garden, reducing the number of hard surfaces on your property and, where possible, choosing a lighter coloured roof for your home or shed.

“The impacts of extreme heat on human health are well known,” Mr Gardiner said.
“We’re trying to get on the front foot and ensure the health and wellbeing of our community.
“That’s why we’re encouraging community members to review the strategy and make a submission; let us know if we’ve covered everything you expected in this strategy, and feel free to make suggestions.”
The draft Urban Cooling Strategy is now on public exhibition, open for submissions until 15 November.
To read the draft Urban Cooling Strategy and submit your feedback, visit connect.wagga.nsw.gov.au/urban-cooling-strategy
